Kafka Connector Monitoring in Production Pipelines
Layered JMX and REST checks reveal whether a pipeline is moving data.
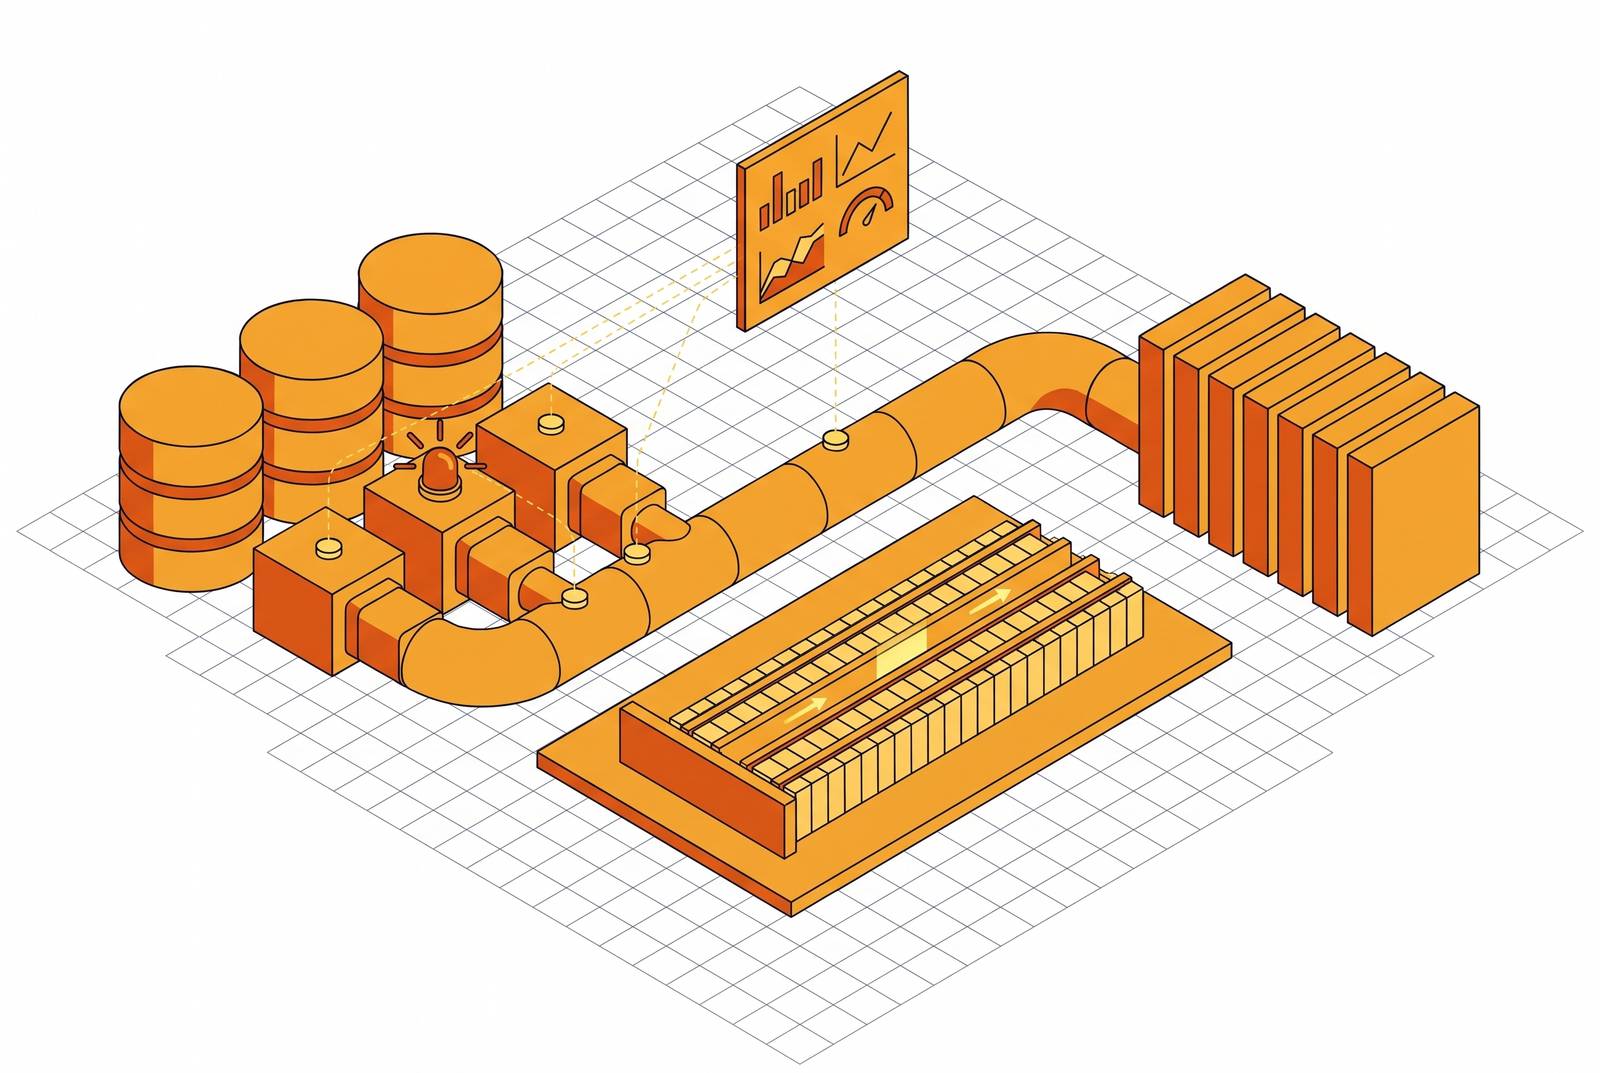
Kafka connector monitoring in production pipelines requires more than a green status indicator. Reliable monitoring brings together worker health, connector state, and task-level metrics, with JMX showing what happens over time and the REST API giving details when something fails. Together, these layers distinguish a process that is running from a pipeline that is moving data correctly, so failures can be caught before they damage downstream systems.
Why Kafka connector monitoring fails in production despite basic health checks
A connector showing RUNNING is not proof that its pipeline is healthy. One task may be retrying, falling behind, or routing records to a dead letter queue while the connector remains active. The health check answers a narrower question than the operator needs answered, leaving the actual progress of the pipeline unexamined until a downstream system breaks.
That gap follows from Kafka Connect’s architecture. The worker JVM process, the connector configuration object, and the tasks that move data are separate operational surfaces. A task failure does not kill its connector, while a worker failure redistributes tasks to surviving workers. Restarting a connector does not reset worker heap pressure, either. Because these layers can fail independently, monitoring just one cannot establish the health of the others.
How Kafka Connect exposes metrics, and why no single source gives the full picture
JMX is Kafka Connect’s primary telemetry surface. Workers expose worker-level, connector-level, and task-level metrics through JMX MBeans, and the OpenTelemetry Java JMX Scraper can collect them and forward them over OTLP without changing connector code. These are the signals for continuous time-series monitoring. Their value comes from placing the latest status in the context of how throughput, resource pressure, and state change over time.
The MBean namespaces separate the three layers. Worker signals appear under kafka.connect:type=connect-worker-metrics, connector signals under kafka.connect:type=connector-metrics,connector=*, and task signals under kafka.connect:type=connector-task-metrics,connector=*,task=*. This separation gives instrumentation a clear set of targets. A state transition tells an operator that something failed without explaining why.
The REST API supplies that failure detail. A request to GET /connectors/{name}/status returns connector state, task states, and the error trace for a failed task. The practical split is to collect JMX metrics continuously through the scraper and query the REST API when a task fails. In a multi-worker cluster, any worker can serve the request because state propagates through the internal connect-status topic.
Layer one: worker-level signals that reveal infrastructure pressure before tasks fail
Worker health is the foundation of the monitoring model because every task depends on the process hosting it. JVM heap usage and GC pause time can show that resources are under strain before a task enters FAILED state. Connector state alone cannot show that pressure. Without separate worker instrumentation, an operator may respond to task failures while leaving the shared cause untouched.
Several worker metrics help explain the pressure. kafka.connect.worker.connector.count records the connectors deployed to a worker, with a rising count indicating rising heap demand. kafka.connect.worker.task.startup.count, broken down by result=success or result=failure, exposes startup failures that can precede task-level FAILED states. Rebalance behavior adds another view of cluster stability through kafka.connect.worker.rebalance.completed.count and kafka.connect.worker.rebalance.time.average. Frequency and duration both deserve attention here.
Rebalances pause all connectors on affected workers, so repeated rebalances can reduce throughput even when every connector shows RUNNING between events. Heap pressure can contribute to this disruption. The recommended worker heap is roughly half to three-fifths of the pod’s memory limit, leaving space for the off-heap buffers used by Kafka client internals. Squeezing that headroom can produce GC pressure that appears as elevated rebalance time before tasks fail. Check both for failing tasks and for a worker already struggling to keep them running.
Layer two: connector state signals and what the status values actually mean operationally
Connector state describes the framework’s view of a connector, but different states call for different responses. Running is normal unless task metrics show a problem. Paused may reflect an intentional operator action or downstream back-pressure, so triage needs to distinguish the two. Failed requires immediate investigation through the REST API, where the error trace supplies the cause that JMX does not provide.
Other states depend on whether they persist. Restarting is transient and warrants an alert when it recurs without resolving to running. Unassigned means no worker has picked up the connector, which is expected briefly after deployment or rebalance but becomes a problem if it continues. Stopped and unknown also appear among the exposed state values.
Degraded is the especially easy state to miss. A connector with five tasks, one of which has failed, can show degraded. A dashboard that pages only on failed therefore misses an active problem while the remaining tasks continue working. For connector-state triage, the REST status response is the first useful action because it puts connector and task states together with the failure trace. That view reveals whether the problem affects the connector as a whole or only part of its work.
Layer three: task-level metrics that show whether data is actually moving
A healthy worker and an active connector still leave the central question unanswered. Is data moving correctly, and at what rate? Task state and throughput provide that evidence, including cases where a RUNNING task routes every record to the dead letter queue. Task states include running, paused, failed, unassigned, restarting, destroyed, and unknown. Failed needs an alert right away, while destroyed and unknown need to be looked into.
Source tasks need signals that describe movement out of the source system. Source poll latency measures how long a task waits for records, and a rise can point to pressure on the source or a misconfigured poll interval. Offset commit success rate answers a different question. If that rate falls, the task may process records without successfully committing its position, creating a risk of reprocessing after restart. Throughput alone would not expose that recovery risk.
Sink put latency measures the time taken to write a batch, and sustained maximum batch latency above 30 seconds warrants an alert for destination pressure. Consumer group lag for the sink connector’s group ID shows whether the sink is keeping up with the source. That signal is outside the Connect metrics namespace. Repeated task restarts add evidence of a poison-pill record, an unhandled downstream write failure, or a connection timeout, with dead letter queue configuration influencing whether the task recovers automatically.
Dead letter queue depth and write rate also show failures that checks of task state miss. A non-zero, growing write rate means records cannot be processed, potentially because of a schema change, a data quality issue, or a configuration mismatch. Those causes need different remedies. For CDC source connectors, the same distinction between activity and progress extends back to the database. Replication slot lag must be monitored there because Kafka throughput can remain high while the WAL grows faster than the connector reads it.
Alerting strategy: separating signals that need a human from signals that resolve themselves
Collecting these signals is only useful if alerts distinguish failures requiring intervention from events that resolve themselves. Otherwise, routine state changes compete for attention with data that is being lost or delayed. Alert fatigue follows quickly from that competition. The decision should turn on the operational meaning of a metric change.
Any failed task should page right away because it needs an explicit restart command to recover. A connector that remains degraded beyond a short threshold should also page because at least one task is no longer doing its work. A dead letter queue write rate that jumps from zero to non-zero shows that records are failing to process and someone needs to look into it. Monotonically growing sink consumer group lag likewise calls for intervention because the destination is falling further behind.
A single rebalance during deployment warrants recording only. Rebalance frequency needs an alert when it stays high over a sustained window. A brief restarting state that resolves to running is also different from a restart loop, just as a throughput drop during a known low-traffic window differs from an unexpected collapse. Context separates these events from incidents. Rate-of-change alerts help tell these cases apart because a sharp rise in errors can need attention even when the absolute rate looks small.
The monitoring system must also survive the failure it reports. If the Connect cluster crashes, its metrics and alerts must remain available to explain what happened. The collector and alerting backend therefore need to run on infrastructure separate from the Connect workers. This is more than a deployment detail. It makes the monitoring model useful precisely when the system under observation is least able to support it.
How the underlying Kafka infrastructure shapes connector monitoring behavior at scale
Separate monitoring infrastructure addresses one dependency, but connector workloads also depend on the Kafka platform beneath them. When compute and storage are tightly coupled, adding connectors puts partition, write-throughput, and retention demand on the same broker-local disks. Scaling then requires a capacity migration alongside an increase in worker count. More workers cannot solve every bottleneck. Source connectors keep writing, sink connectors keep consuming, and replay needs both data that has been retained and enough read capacity to catch up.
Compute-storage separation changes those constraints. When data is written directly to object storage with erasure coding for durability, brokers become stateless enough for broker scaling and connector worker scaling to proceed independently. Connector workload changes are typically compute-heavy before they are storage-heavy, so separating those dimensions reduces their operational coupling. The monitoring layers still remain necessary. What changes is the infrastructure response available when their signals show that the workload has outgrown its current capacity.
A governed connector catalog also relies on architecture to enforce its controls. Offset inspection, credential boundaries, private network placement, and replay capacity depend on the platform as well as the connector. In security-sensitive or regulated environments, requirements to keep data within the customer’s cloud account or controlled network boundary also constrain where monitoring agents, collectors, and log storage may run. A BYOC data plane keeps the monitoring pipeline within that boundary, and it still needs separate infrastructure so it can survive worker failures.
A practical runbook: wiring the three layers into a coherent incident response
The first step is to check JVM heap usage and GC pause time on the affected worker. A full heap changes how later evidence should be read. Task failures may be symptoms of the worker’s condition, so the worker needs attention before tasks are restarted.
The second step is to request connector status through GET /connectors/{name}/status. A failed connector and a degraded connector imply different scopes of attention, with the latter pointing to a subset of tasks. The third step stays with that response. Task states and error traces show which tasks failed and give details about the cause that JMX alone cannot show.
The fourth step is to check the dead letter queue depth and the sink consumer lag. A task that remains RUNNING while routing records to the queue or accumulating lag has a data quality or throughput failure. The fifth step applies to CDC source connectors. Replication slot lag at the database can reveal that the source is falling behind even when Kafka-layer signals look healthy.
The internal connect-status topic also keeps a record of connector and task states. With high replication and compaction, that history can support examination of state transitions after a worker restart. Before concluding that a connector is healthy, the runbook should confirm that the scraper and collector are healthy. Missing telemetry cannot establish pipeline health, and a silent monitoring failure can otherwise remain indistinguishable from a silent connector failure until downstream data stops arriving.